
Acoustic measurement is essential for designing loudspeaker products and evaluating their performance. Since what users hear in a room is a combination of the loudspeaker’s direct sound and the room’s reflections, relying solely on traditional on-axis frequency response measurements is not sufficient to accurately assess a speaker’s real-world performance and tonality.
To more thoroughly measure a loudspeaker’s acoustic behaviour and predict its tonal character, the “ANSI/CTA-2034-A Standard Method of Measurement for In-Home Loudspeakers” (often simply called CTA-2034 Spinorama) can be used. This standard is based on research conducted by Dr. Floyd Toole in collaboration with Canada’s National Research Council starting in the 1980s, focusing on the relationship between a speaker’s measured acoustic behaviour and human subjective perception. Nowadays, more and more pro-audio and hi-fi brands are adopting this standard in their product design process and publishing their performance data.
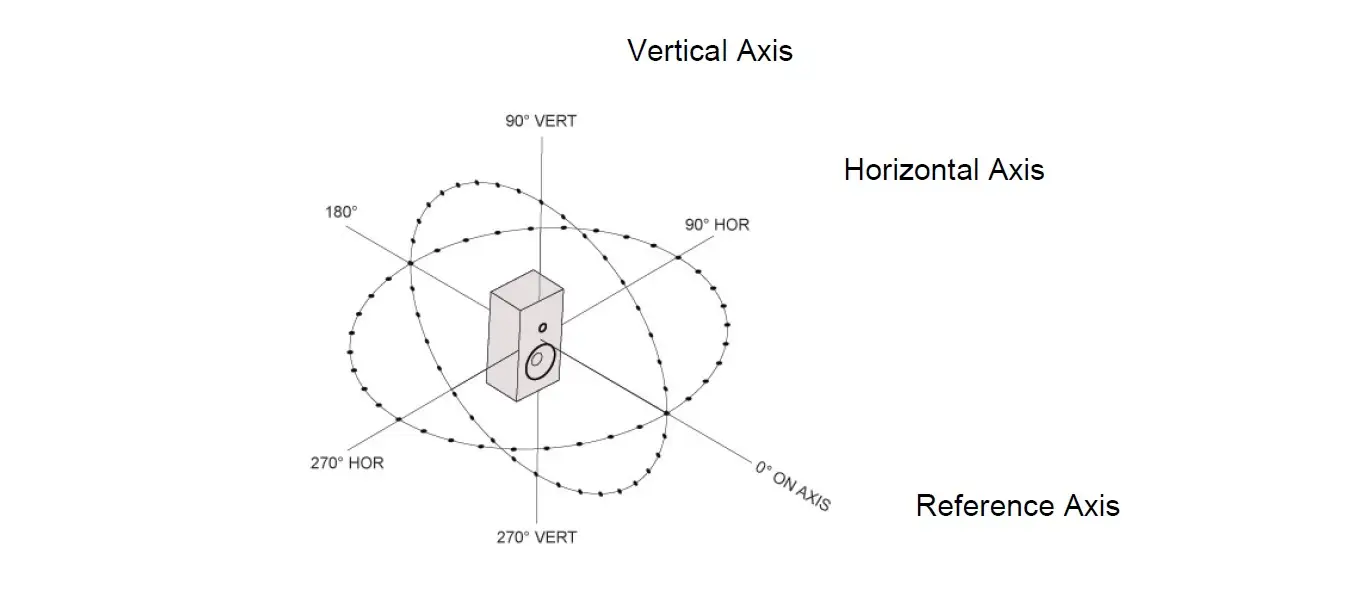
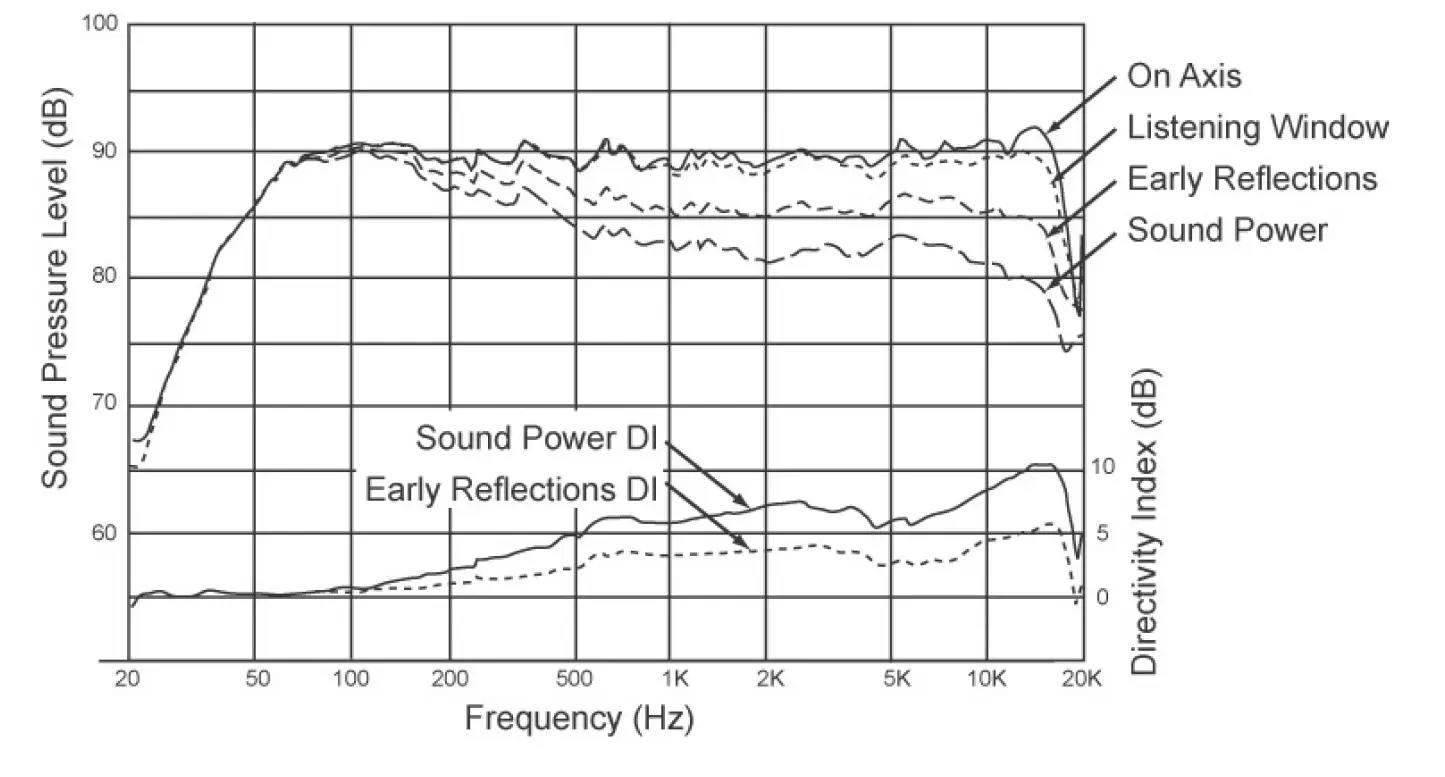
According to the standard, generating a Spinorama requires measuring the speaker system’s frequency response with a 2.83v sweep signal at 70 positions on two circular paths with a 2-meter radius on the horizontal and vertical planes, spaced at 10° intervals. Since drivers in larger loudspeakers can be spaced further apart, a 2-meter distance is standardised to ensure the microphone remains in the far-field region of the system. However, when outputting data, the results are normalised to 1-meter SPL (simply +6dB) for consistency and other uses. The reference axis for measurement is not fixed by the standard; manufacturers must decide whether to use the tweeter position or the point between the midrange and tweeter, and must clearly specify it when publishing the data. After collecting and processing the measurements, seven main reference curves can be obtained, which will be explained one by one below.
On-axis Frequency Response (ON)
The frequency response measured at 1 meter directly in front of the speaker on the reference axis. From this curve, we can determine the speaker’s sensitivity (SPL @ 1m / 2.83v), typically by averaging the SPL between 500Hz and 2000Hz. Knowing the sensitivity allows us to derive other basic specs, such as the -6dB cutoff frequencies for bass and treble.
Listening Window (LW)
This curve averages the frequency responses of nine points within an elliptical window in front of the loudspeaker: the reference axis, ±10° vertical, and ±10° to ±30° horizontal. Early research found that in most real-world listening environments, users rarely fully toe-in their speakers, and the listening angle often falls within this range. Thus, the Listening Window more accurately represents the direct sound that listeners actually perceive from the loudspeaker.
Early Reflections (ER)
This curve estimates the frequency response of the first reflections a loudspeaker would produce in a typical room. Of course, it does not account for wall absorption coefficients or the exact distances and angles between walls and speakers. Instead, it averages the frequency responses over the front 180° hemisphere. It can be further divided into ground, ceiling, front wall, side walls, and rear wall reflections, although usually only the overall average is displayed. Since loudspeakers generally have narrowing directivity from low to high frequencies, meaning off-axis energy decreases at higher frequencies, the ER curve typically tilts downward sooner than the LW curve. If there are response nulls caused by crossover design decisions or driver directivity mismatch, these will also show up in the ER curve. In real-world home listening environments, reflected sound dominates what listeners hear, making the ER curve an extremely important indicator of perceived speaker performance.
Sound Power (SP)
This curve is obtained by taking a weighted average of all 70 measurement points, representing the total radiated energy of the loudspeaker system. Due to typical directivity patterns, mid and high frequencies reaching the rear hemisphere are reduced, resulting in a steeper downward tilt of the SP curve compared to the ER curve. Like ER, SP is an important indicator of a speaker’s tonal balance and reveals issues related to system directivity.
Sound Power Directivity Index (SPDI)
Unlike the four curves above, this is not a frequency response curve but rather the difference between the Listening Window (LW) and the Sound Power (SP) response. It describes the loudspeaker’s directivity behaviour. If the SPDI curve is flat at 0dB, it means the speaker is fully omnidirectional, radiating evenly in all directions. Higher values indicate narrower directivity (more focused sound). Large fluctuations in the SPDI curve suggest uneven directivity, meaning the speaker might sound inconsistent in different rooms or at different listening positions.
Early Reflections Directivity Index (ERDI)
Similar to SPDI, but it compares the Listening Window to the Early Reflections response. Since most modern speakers are forward-firing designs, the ERDI, which focuses on the front hemisphere, is often slightly more meaningful than SPDI. Again, strong fluctuations indicate inconsistent directivity. The directivity index is related to a speaker’s imaging capabilities. Speakers with lower directivity indices typically create a wider soundstage due to stronger lateral reflections but may suffer from less precise imaging compared to speakers with tighter directivity (assuming the curve itself is smooth).
Estimated In-Room Response (EIR)
This curve estimates the expected in-room frequency response at the listening position. It is calculated as:
12% (LW) + 44% (ER) + 44% (SP).
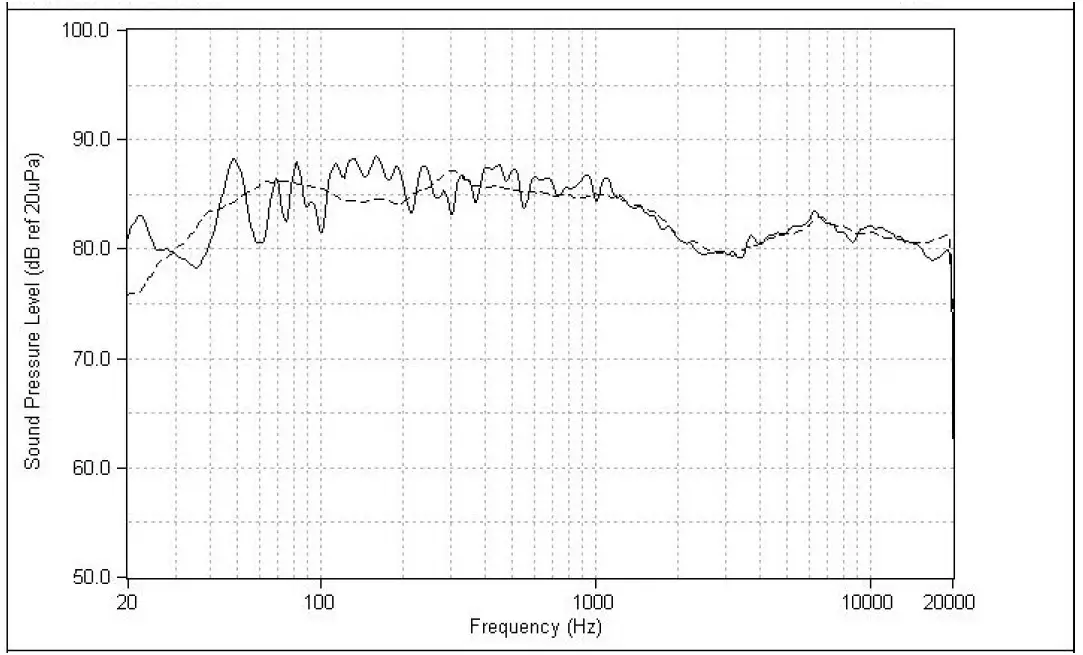
Naturally, it cannot account for room modes affecting the low and midbass, nor for the specific speaker angles or distances. However, in most cases, the EIR closely matches actual in-room measurement trends (see Figure 2). If you could only look at one curve to understand a speaker’s tonal balance, the EIR would be the most valuable.
Spinorama analysis helps engineers effectively diagnose problems in loudspeaker design. For example, if a peak or dip appears only in the ON curve but not in the ER or SP curves, it likely results from diffraction effects. In contrast, features present across all curves often point to resonances or crossover design flaws. Some manufacturers strive for flat on-axis responses during design, but this doesn’t always guarantee accurate tonality reproduction, since a flat on-axis response can be achieved by artificially compensating for diffraction dips, causing peaks in the ER and SP curves.
Conclusion
Jazz Hipster deeply understands the importance of advanced acoustic measurement standards like CTA-2034 Spinorama for designing high-quality loudspeaker products that meet modern user expectations. Our engineering team, with years of professional acoustic experience, continuously researches and masters the principles and analysis methods behind these complex standards.
We integrate our understanding of advanced acoustic evaluation methods like CTA-2034 into our loudspeaker product design, development, and optimization processes. This not only assists in analyzing potential issues but, more importantly, utilizes these deep acoustic insights to guide product improvement, ensuring the final product delivers exceptional sound performance in real listening environments.
For clients seeking products that meet high-standard acoustic performance and require professional acoustic design and evaluation, Jazz Hipster can leverage our accumulated years of know-how, combined with the expertise of our internal engineering team and the specialized capabilities of external consultants/partners, to provide professional consultation and technical solutions based on a deep understanding of advanced acoustic standards (including but not limited to CTA-2034), even including related advanced measurement and analysis support. We are committed to being a steadfast partner in your loudspeaker product development, assisting you in achieving your acoustic goals.
